Oilsprings Splunk
OT telemetry piped directly into Splunk.
Oilsprings Splunk extends the base Oilsprings environment with a full Splunk integration layer — routing real OT telemetry from PLC and SCADA systems into a production-grade SIEM pipeline.
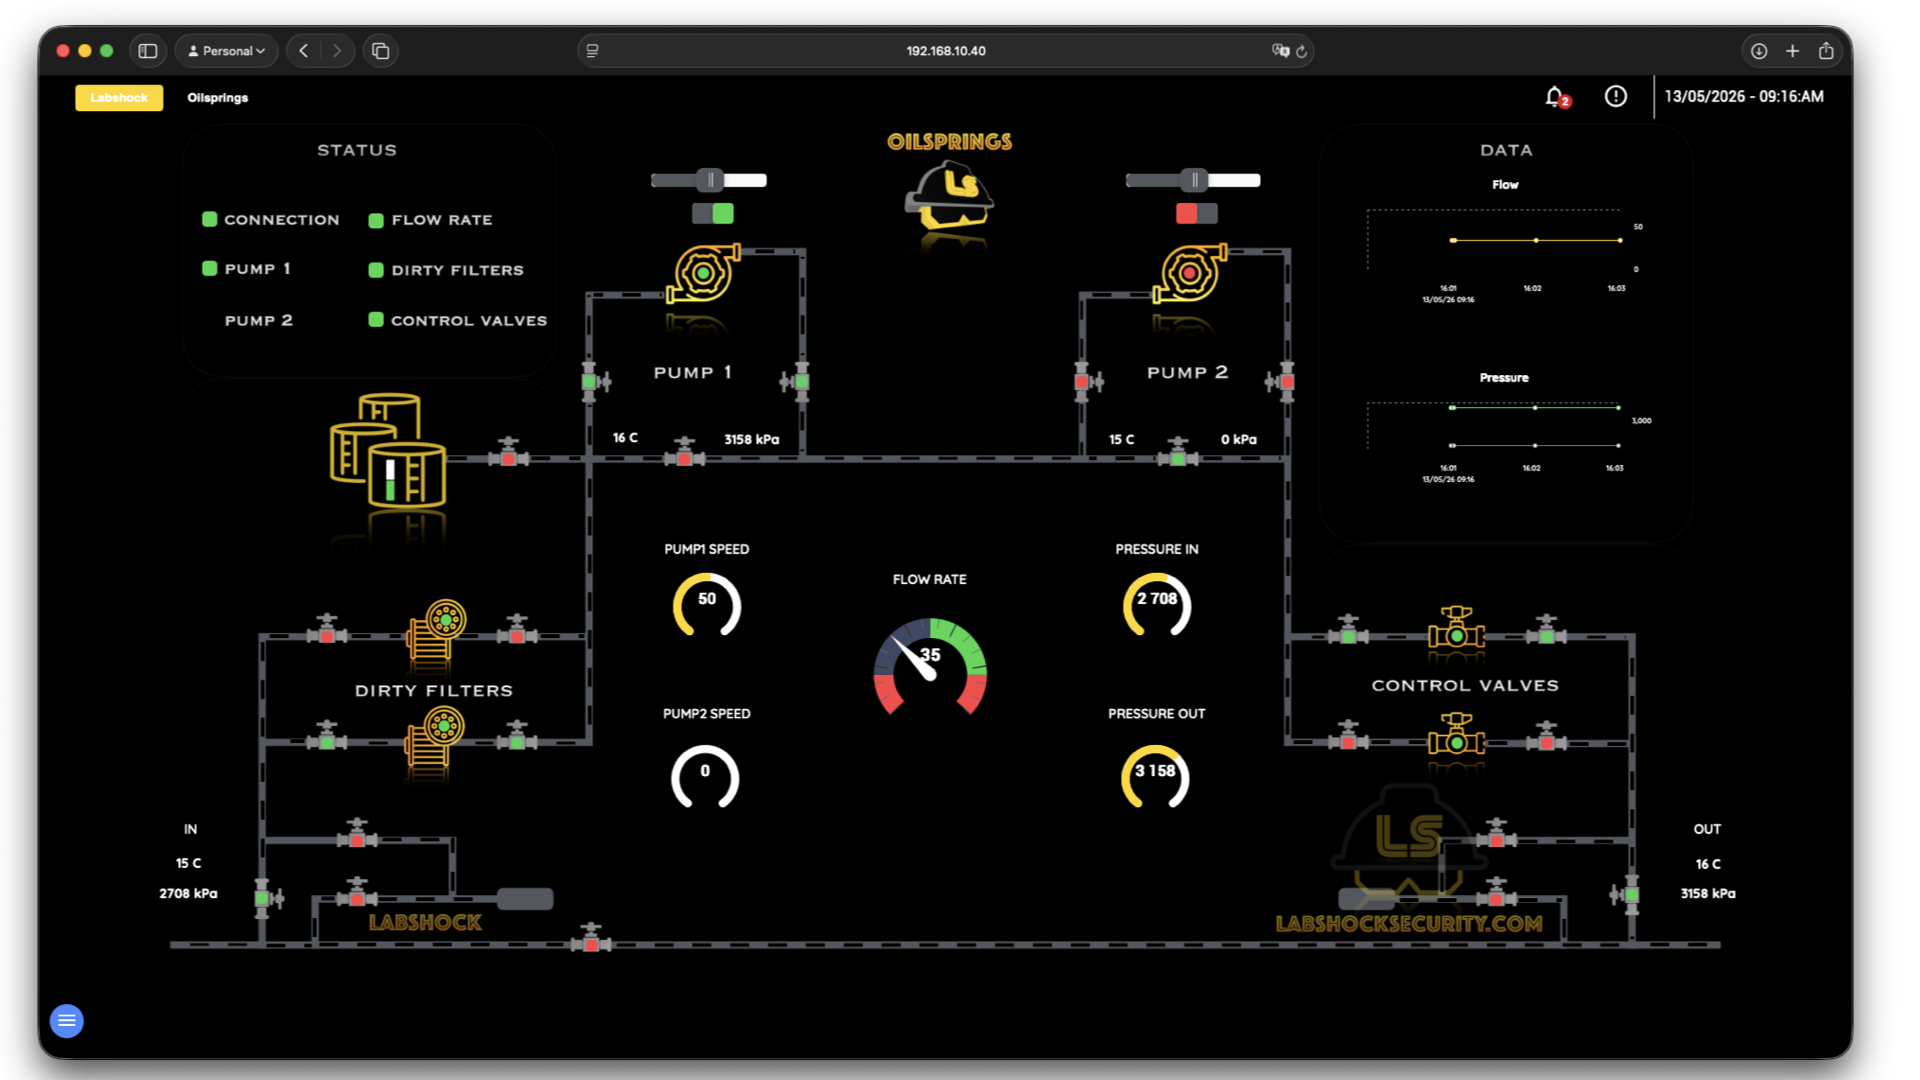
The lab adds a Splunk instance pre-configured to receive industrial event data from Tidal Collector. Every PLC state change, SCADA operator action, and IDS detection fires into Splunk in real time. Pre-built dashboards surface OT-specific views: process state, network anomalies, and control system events.
Users can validate detection rules, build correlation searches against real industrial data, and test SOC workflows using events generated by actual Modbus traffic and PLC logic execution.
The Oilsprings basin was running blind for years. The SCADA panel showed green. The pumps ran. Nobody looked deeper because there was nothing to look with.
Then the auditors came. They asked one question: where do your logs go? The answer was nowhere. They left a requirement behind: you need visibility.
The engineers ran a collector cable from the control shed to a server room three buildings over. They installed Splunk on hardware that had been sitting in a shipping crate since the previous budget cycle. They piped everything in — PLC events, network captures, SCADA sessions.
The first dashboard came online at 03:14 on a Tuesday. By 03:17 it had already surfaced three anomalies that nobody knew existed. Oilsprings Splunk is what happens when a field that never had eyes finally gets them.